Edit chart
Loading graph
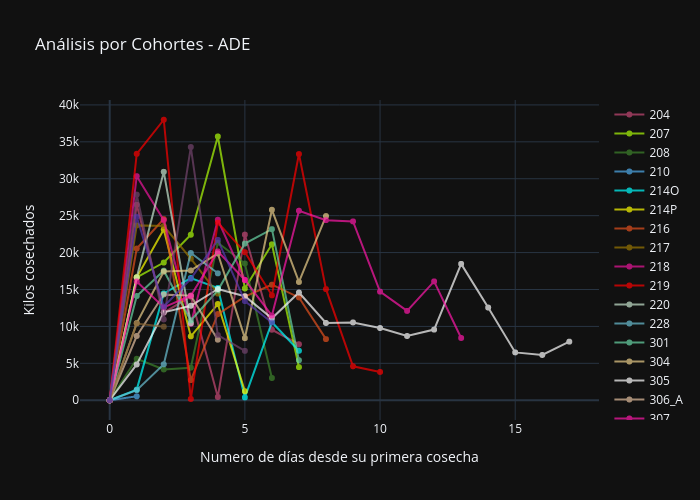
Adeadmin's interactive graph and data of "Análisis por Cohortes - ADE" is a scatter chart, showing 202, 204, 207, 208, 210, 212, 214O, 214P, 215, 216, 217, 218, 219, 220, 228, 301, 303, 304, 305, 306_A, 307, 461, 464, 467, 468, 469; with Numero de días desde su primera cosecha in the x-axis and Kilos cosechados in the y-axis.. The x-axis shows values from 0 to 0. The y-axis shows values from 0 to 0.