Edit chart
Loading graph
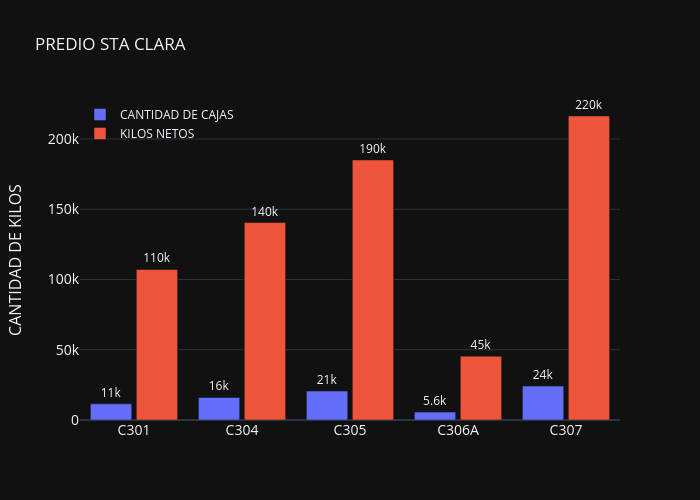
Adeadmin's interactive graph and data of "PREDIO STA CLARA" is a grouped bar chart, showing CANTIDAD DE CAJAS vs KILOS NETOS; with CANTIDAD DE KILOS in the y-axis. The x-axis shows values from 0 to 0. The y-axis shows values from 0 to 0.