Edit chart
Loading graph
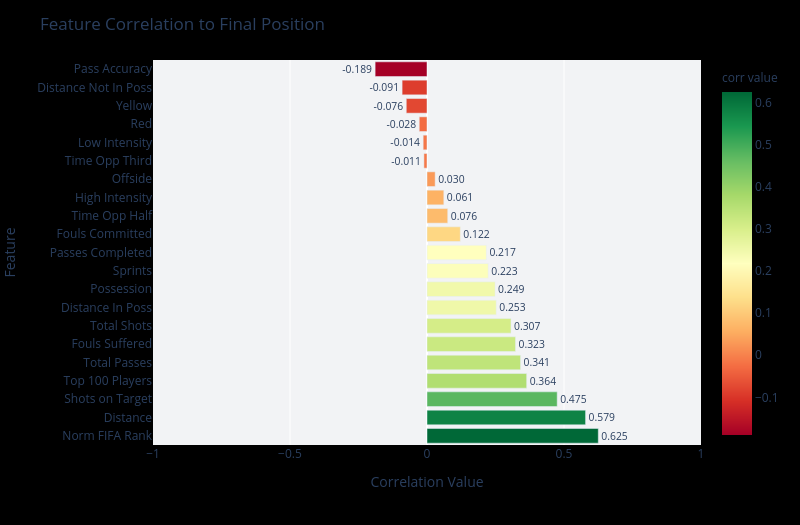
Acpoll's interactive graph and data of "Feature Correlation to Final Position" is a bar chart; with Correlation Value in the x-axis and Feature in the y-axis.. The x-axis shows values from -1 to 1. The y-axis shows values from -0.5 to 20.5.