Edit chart
Loading graph
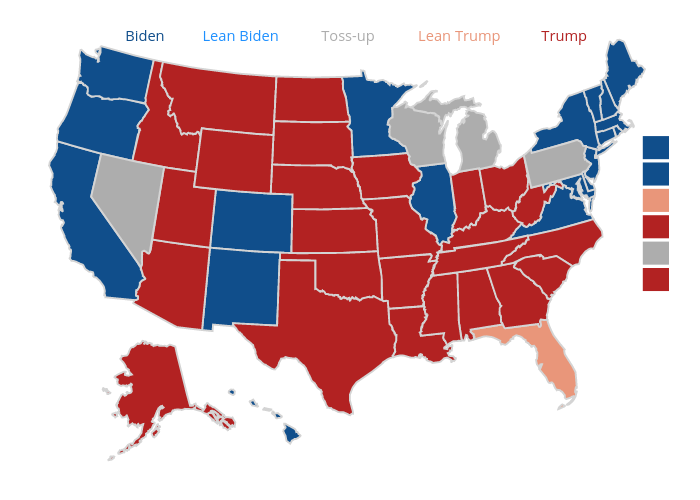
Acbass49's interactive graph and data is a filled line chart. The x-axis shows values from -2268500.29815871 to 2936595.25229327. The y-axis shows values from -2622911.86648128 to 910614.850784823.