Edit chart
Loading graph
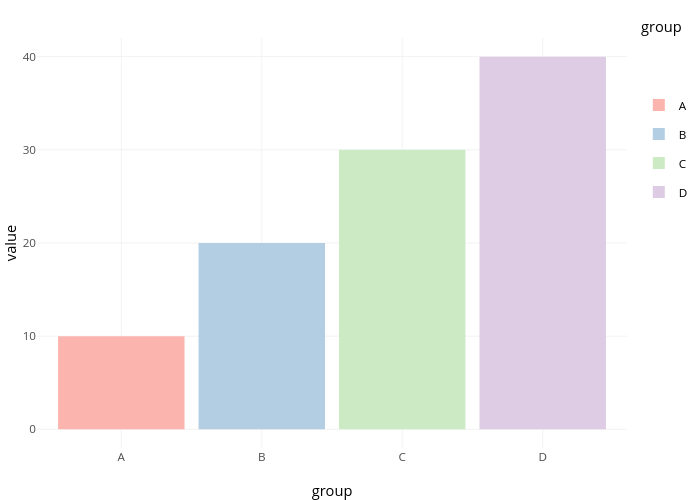
Y_data's interactive graph and data of "value vs group" is a , showing A, B, C, D; with group in the x-axis and value in the y-axis.. The x-axis shows values from 0.4 to 4.6. The y-axis shows values from -2 to 42. This visualization has the following annotation: group