Edit chart
Loading graph
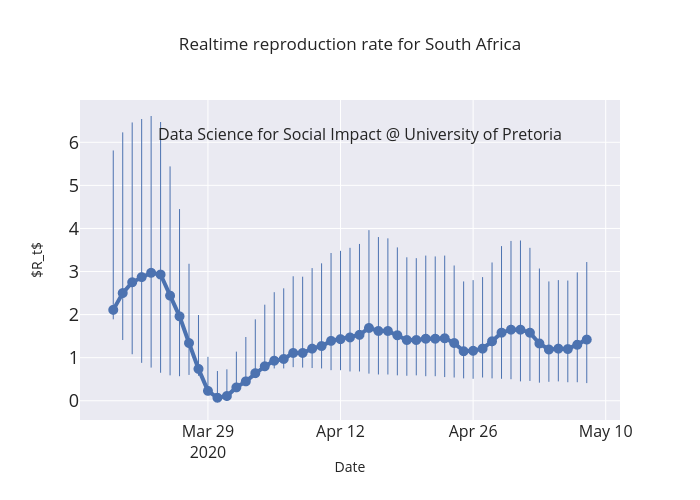
Vukosimarivate's interactive graph and data of "Realtime reproduction rate for South Africa" is a with vertical error bars; with Date in the x-axis and $R_t$ in the y-axis.. The x-axis shows values from 2020-03-15 17:49:57.8471 to 2020-05-11 06:10:02.1529. The y-axis shows values from -0.41687186828919115 to 6.979835361488905. This visualization has the following annotation: Data Science for Social Impact @ University of Pretoria