Edit chart
Loading graph
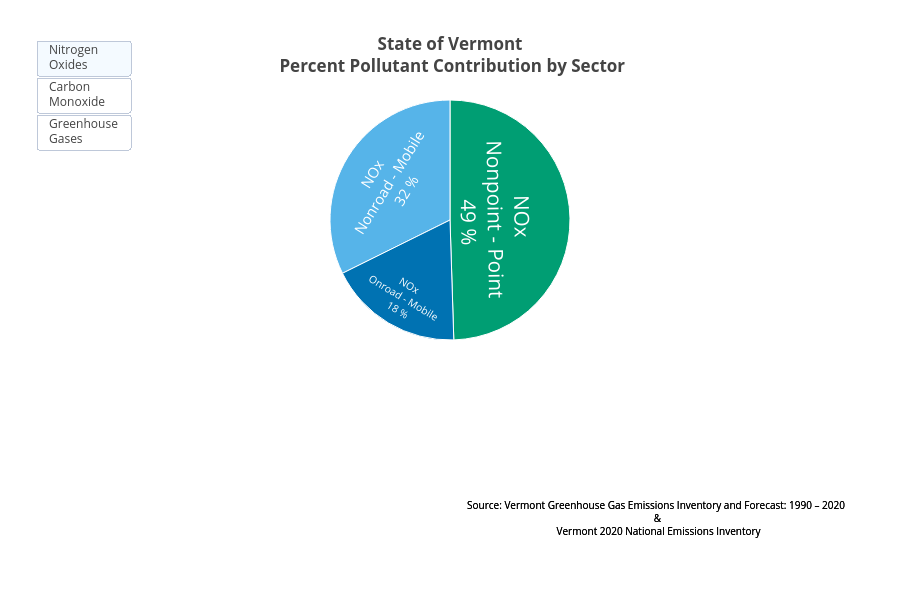
Vtaqcd's interactive graph and data of " State of Vermont Percent Pollutant Contribution by Sector" is a pie. The x-axis shows values from 0 to 0. The y-axis shows values from 0 to 0. This visualization has the following annotations: Source: Vermont Greenhouse Gas Emissions Inventory and Forecast: 1990 – 2020 & Vermont 2020 National Emissions Inventory; Source: Vermont Greenhouse Gas Emissions Inventory and Forecast: 1990 – 2020 & Vermont 2020 National Emissions Inventory