Edit chart
Loading graph
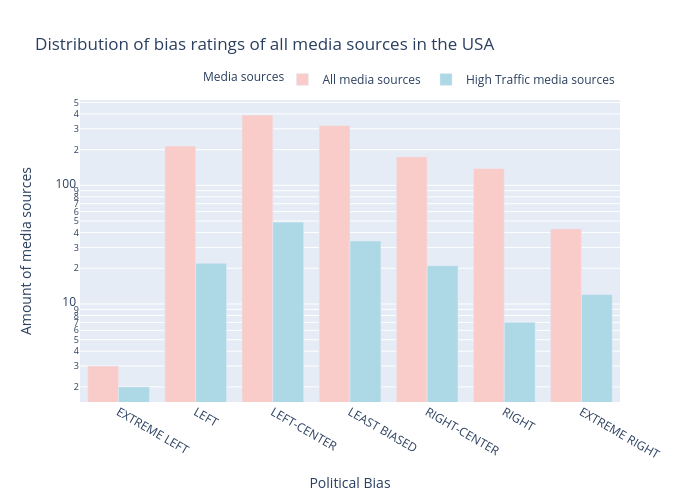
Vfayt99's interactive graph and data of "Distribution of bias ratings of all media sources in the USA" is a grouped bar chart, showing All media sources vs High Traffic media sources; with Political Bias in the x-axis and Amount of media sources in the y-axis.. The x-axis shows values from 0 to 0. The y-axis shows values from 0 to 0.