Edit chart
Loading graph
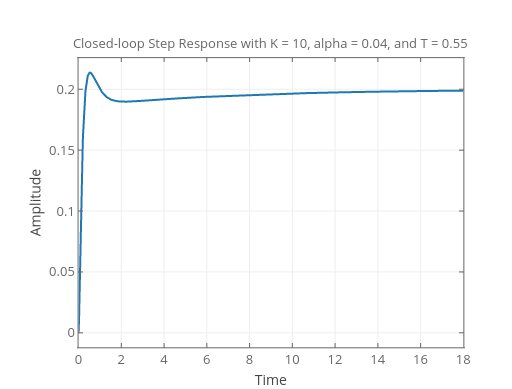
Umichigancontrol's interactive graph and data of "Amplitude vs Time" is a scatter chart, showing Amplitude; with Time in the x-axis and Amplitude in the y-axis.. The x-axis shows values from 0 to 18. The y-axis shows values from -0.01187217 to 0.2255713. This visualization has the following annotation: Closed-loop Step Response with K = 10, alpha = 0.04, and T = 0.55