Edit chart
Loading graph
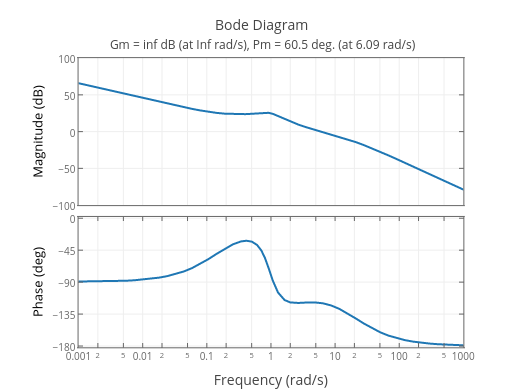
Umichigancontrol's interactive graph and data of "Magnitude vs Phase" is a scatter chart, showing Magnitude vs Phase; with Magnitude (dB) in the y-axis. The x-axis shows values from -3 to 3. The y-axis shows values from -100 to 100. This visualization has the following annotations: Gm = inf dB (at Inf rad/s), Pm = 60.5 deg. (at 6.09 rad/s); Bode Diagram