Edit chart
Loading graph
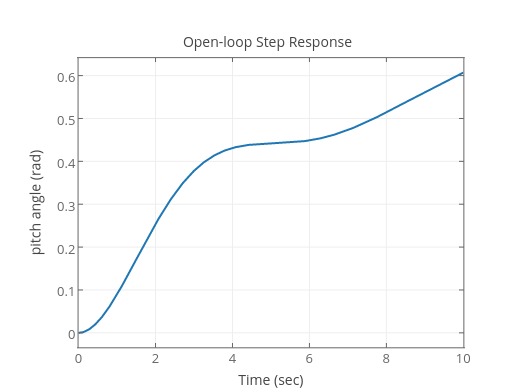
Umichigancontrol's interactive graph and data of "pitch angle (rad) vs Time (sec)" is a scatter chart, showing Pitch angle; with Time (sec) in the x-axis and pitch angle (rad) in the y-axis.. The x-axis shows values from 0 to 10. The y-axis shows values from -0.03372527777777778 to 0.6407802777777778. This visualization has the following annotation: Open-loop Step Response