Edit chart
Loading graph
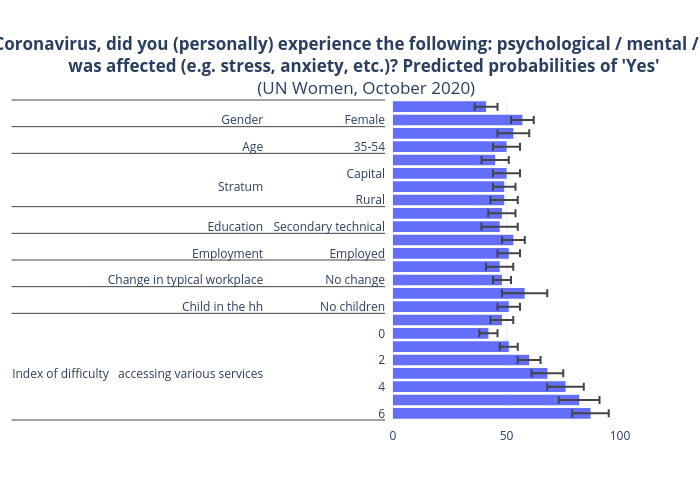
Tsisana_kh's interactive graph and data of "As a result of Coronavirus, did you (personally) experience the following: psychological / mental / emotional healthwas affected (e.g. stress, anxiety, etc.)? Predicted probabilities of 'Yes' (UN Women, October 2020)" is a bar chart. The x-axis shows values from 0 to 100. The y-axis shows values from -0.5 to 23.5.