Edit chart
Loading graph
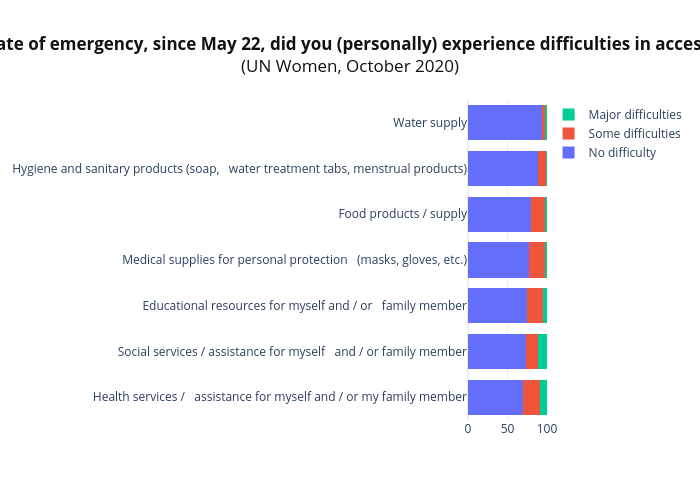
Tsisana_kh's interactive graph and data of "Since the end of the state of emergency, since May 22, did you (personally) experience difficulties in accessing basic services: (%)(UN Women, October 2020)" is a stacked bar chart, showing No difficulty, Some difficulties, Major difficulties. The x-axis shows values from 0 to 100. The y-axis shows values from -0.5 to 6.5.