Edit chart
Loading graph
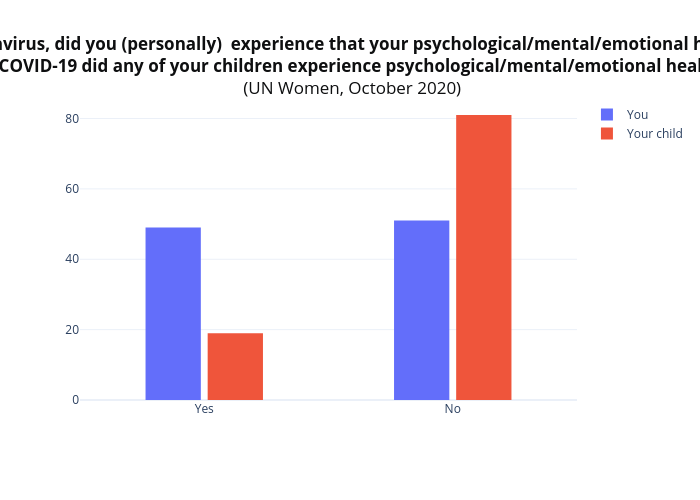
Tsisana_kh's interactive graph and data of "As a result of Coronavirus, did you (personally) experience that your psychological/mental/emotional health was affected? As a result of COVID-19 did any of your children experience psychological/mental/emotional health issues? (%) (UN Women, October 2020)" is a bar chart, showing You vs Your child. The x-axis shows values from -0.5 to 1.5. The y-axis shows values from 0 to 85.26315789473684.