Edit chart
Loading graph
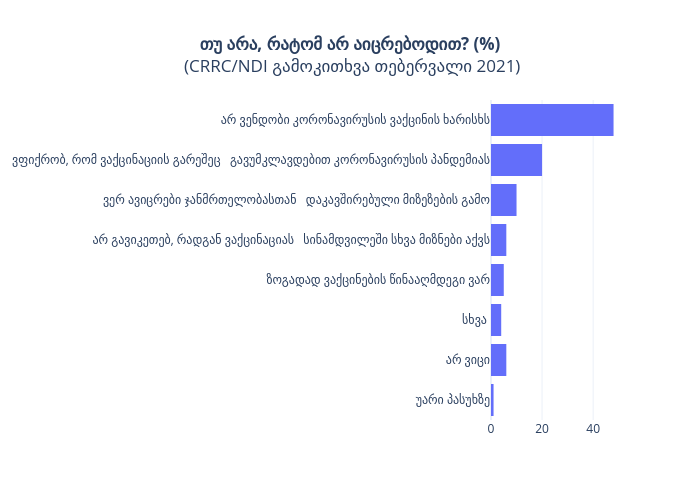
Tsisana_kh's interactive graph and data of "თუ არა, რატომ არ აიცრებოდით? (%) (CRRC/NDI გამოკითხვა თებერვალი 2021)" is a bar chart. The x-axis shows values from 0 to 50.526315789473685. The y-axis shows values from -0.5 to 7.5.