Edit chart
Loading graph
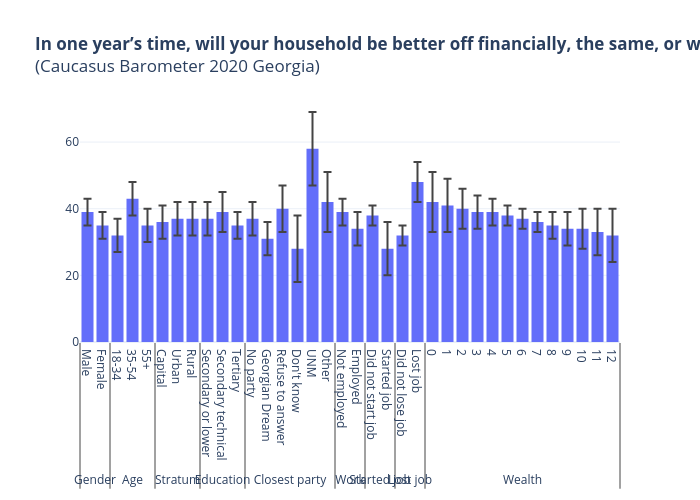
Tsisana_kh's interactive graph and data of "In one year’s time, will your household be better off financially, the same, or worse off? Predicted probabilities of 'Worse off'(Caucasus Barometer 2020 Georgia)" is a bar chartwith vertical error bars. The x-axis shows values from -0.5 to 35.5. The y-axis shows values from 0 to 72.63157894736842.