Edit chart
Loading graph
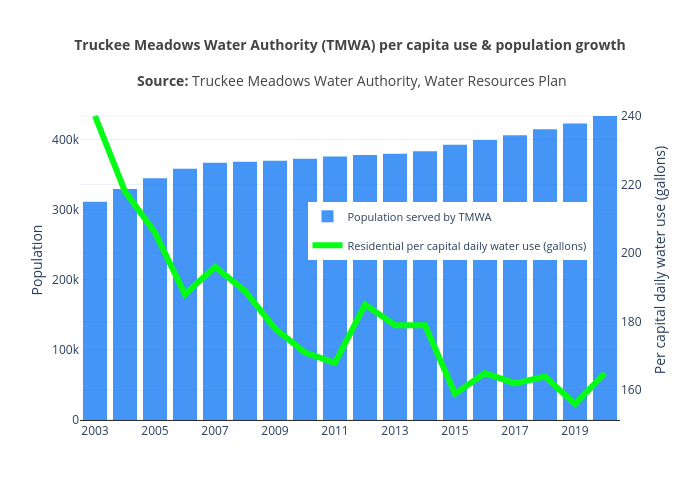
Truckeemeadowstomorrow's interactive graph and data of "Truckee Meadows Water Authority (TMWA) per capita use & population growth Source: Truckee Meadows Water Authority, Water Resources Plan" is a filled grouped bar chart, showing Population served by TMWA vs Residential per capital daily water use (gallons); with Population in the y-axis. The x-axis shows values from 2002.5 to 2020.5. The y-axis shows values from 0 to 456433.6842105263.