Edit chart
Loading graph
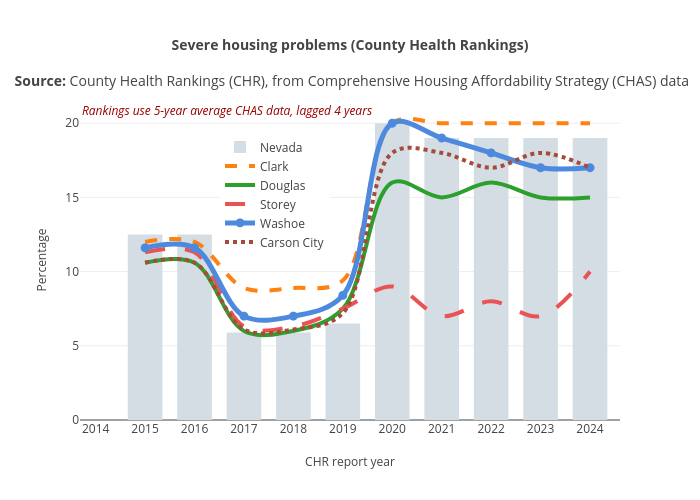
Truckeemeadowstomorrow's interactive graph and data of "Severe housing problems (County Health Rankings) Source: County Health Rankings (CHR), from Comprehensive Housing Affordability Strategy (CHAS) data" is a bar chart, showing Nevada, Clark, Douglas, Storey, Washoe, Carson City; with CHR report year in the x-axis and Percentage in the y-axis.. The x-axis shows values from 2014.4633027522937 to 2024.5366972477063. The y-axis shows values from 0 to 21.4307317454502. This visualization has the following annotation: Rankings use 5-year average CHAS data, lagged 4 years