Edit chart
Loading graph
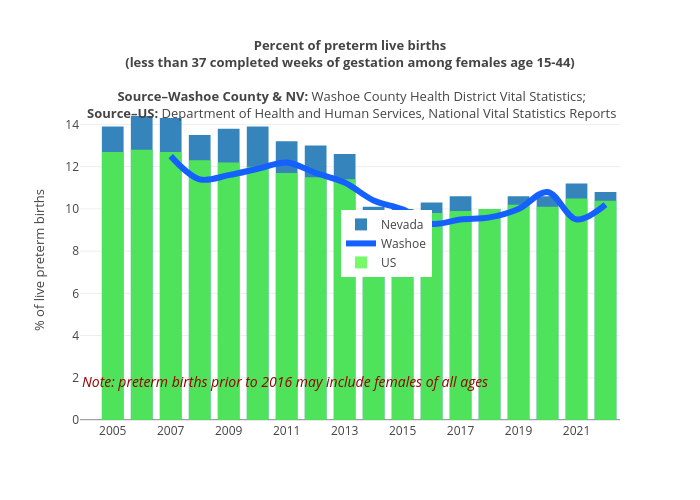
Truckeemeadowstomorrow's interactive graph and data of "Percent of preterm live births(less than 37 completed weeks of gestation among females age 15-44) Source–Washoe County & NV: Washoe County Health District Vital Statistics; Source–US: Department of Health and Human Services, National Vital Statistics Reports" is a overlaid bar chart, showing Nevada, Washoe, US; with {'font': {'size': 13}} in the x-axis and % of live preterm births in the y-axis.. The x-axis shows values from 2004.5 to 2022.5. The y-axis shows values from 0 to 15.157894736842106. This visualization has the following annotation: Note: preterm births prior to 2016 may include females of all ages