Edit chart
Loading graph
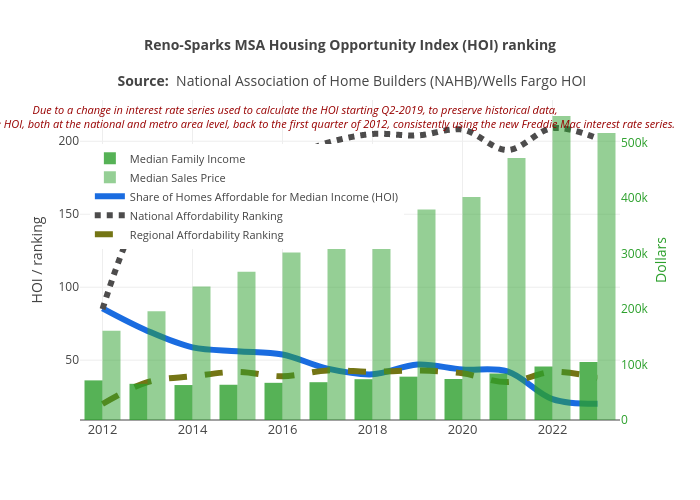
Truckeemeadowstomorrow's interactive graph and data of "Reno-Sparks MSA Housing Opportunity Index (HOI) ranking Source: National Association of Home Builders (NAHB)/Wells Fargo HOI" is a grouped bar chart, showing Median Family Income, Median Sales Price, Share of Homes Affordable for Median Income (HOI), National Affordability Ranking, Regional Affordability Ranking; with in the x-axis and HOI / ranking in the y-axis.. The x-axis shows values from 2011.5 to 2023.5. The y-axis shows values from 9.352990227768876 to 222.29318567239136. This visualization has the following annotation: Due to a change in interest rate series used to calculate the HOI starting Q2-2019, to preserve historical data, NAHB revised the HOI, both at the national and metro area level, back to the first quarter of 2012, consistently using the new Freddie Mac interest rate series.