Edit chart
Loading graph
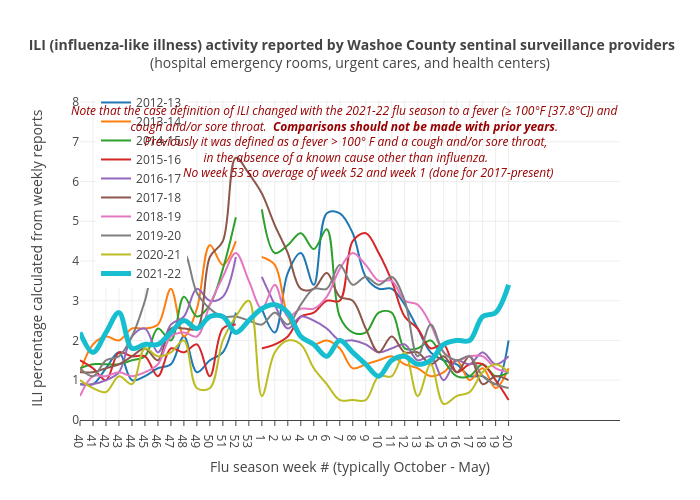
Truckeemeadowstomorrow's interactive graph and data of " ILI (influenza-like illness) activity reported by Washoe County sentinal surveillance providers(hospital emergency rooms, urgent cares, and health centers)" is a line chart, showing 2012-13, 2013-14, 2014-15, 2015-16, 2016-17, 2017-18, 2018-19, 2019-20, 2020-21, 2021-22; with Flu season week # (typically October - May) in the x-axis and ILI percentage calculated from weekly reports in the y-axis.. The x-axis shows values from 0 to 33. The y-axis shows values from 0.011580960711935373 to 7.779961746473229. This visualization has the following annotations: No week 53 so average of week 52 and week 1 (done for 2017-present); Note that the case definition of ILI changed with the 2021-22 flu season to a fever (≥ 100°F [37.8°C]) andcough and/or sore throat. Comparisons should not be made with prior years. Previously it was defined as a fever > 100° F and a cough and/or sore throat, in the absence of a known cause other than influenza.