Edit chart
Loading graph
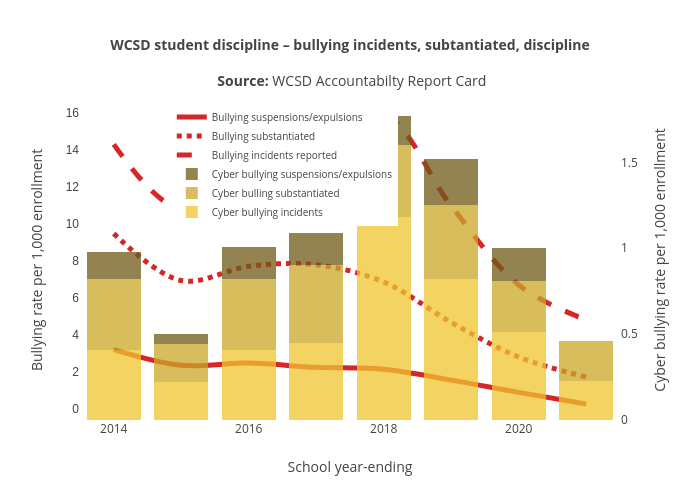
Truckeemeadowstomorrow's interactive graph and data of "WCSD student discipline – bullying incidents, subtantiated, discipline Source: WCSD Accountabilty Report Card" is a stacked bar chart, showing Cyber bullying incidents, Cyber bulling substantiated, Cyber bullying suspensions/expulsions, Bullying incidents reported, Bullying substantiated, Bullying suspensions/expulsions; with School year-ending in the x-axis and Bullying rate per 1,000 enrollment in the y-axis.. The x-axis shows values from 2013.5 to 2021.5. The y-axis shows values from -0.6244444444444446 to 16.664444444444445.