Edit chart
Loading graph
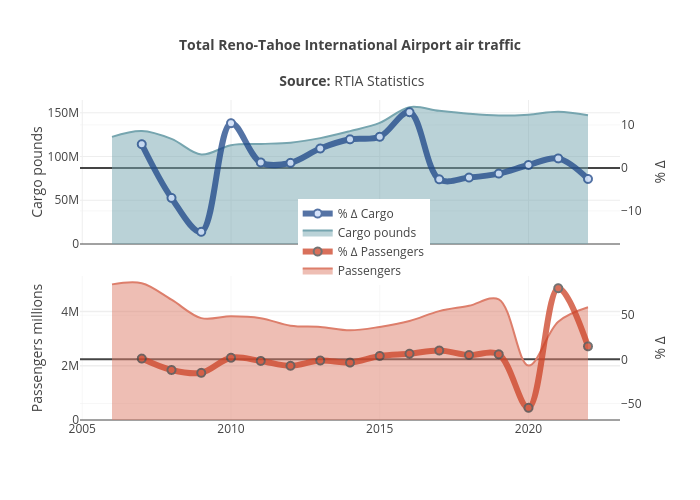
Truckeemeadowstomorrow's interactive graph and data of "Total Reno-Tahoe International Airport air traffic Source: RTIA Statistics" is a filled line chart, showing Passengers, % ∆ Passengers, Cargo pounds, % ∆ Cargo; with in the x-axis and Passengers millions in the y-axis.. The x-axis shows values from 2004.9528049866428 to 2023.0471950133572. The y-axis shows values from 0 to 5309565.263157895.