Edit chart
Loading graph
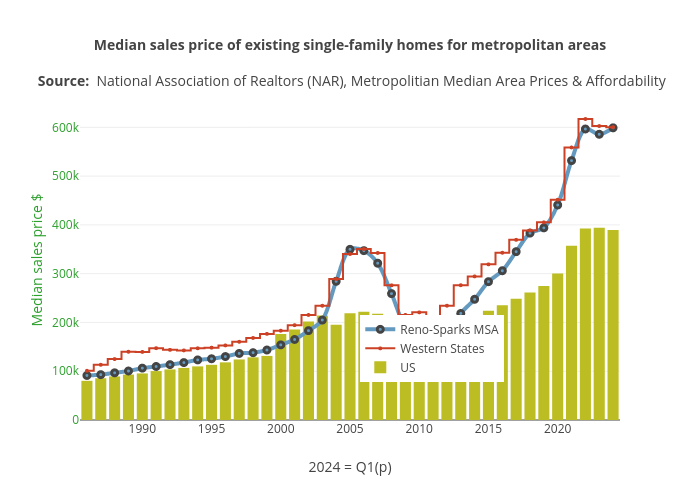
Truckeemeadowstomorrow's interactive graph and data of "Median sales price of existing single-family homes for metropolitan areas Source: National Association of Realtors (NAR), Metropolitian Median Area Prices & Affordability" is a line chart, showing Reno-Sparks MSA, Western States, US; with 2023 preliminary in the x-axis and Median sales price $ in the y-axis.. The x-axis shows values from 1985.5 to 2023.5. The y-axis shows values from 0 to 652794.9500783893.