Edit chart
Loading graph
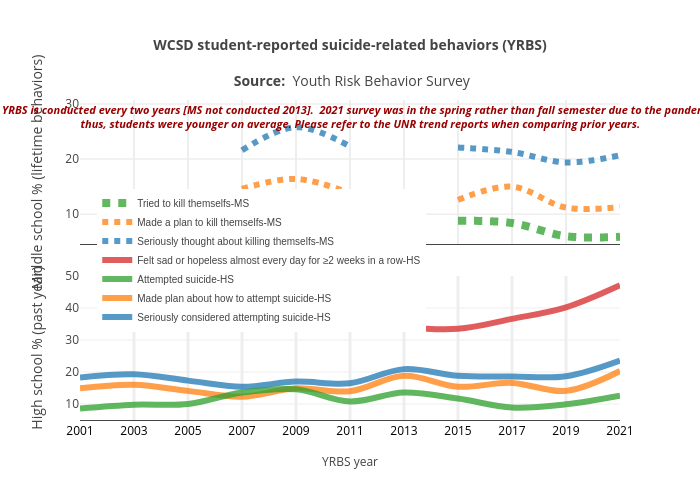
Truckeemeadowstomorrow's interactive graph and data of "WCSD student-reported suicide-related behaviors (YRBS) Source: Youth Risk Behavior Survey" is a line chart, showing Seriously considered attempting suicide-HS, Made plan about how to attempt suicide-HS, Attempted suicide-HS, Felt sad or hopeless almost every day for ≥2 weeks in a row-HS, Seriously thought about killing themselfs-MS, Made a plan to kill themselfs-MS, Tried to kill themselfs-MS; with YRBS year in the x-axis and High school % (past year) in the y-axis.. The x-axis shows values from 2001 to 2021. The y-axis shows values from 5 to 50. This visualization has the following annotation: YRBS is conducted every two years [MS not conducted 2013]. 2021 survey was in the spring rather than fall semester due to the pandemic,thus, students were younger on average. Please refer to the UNR trend reports when comparing prior years.