Edit chart
Loading graph
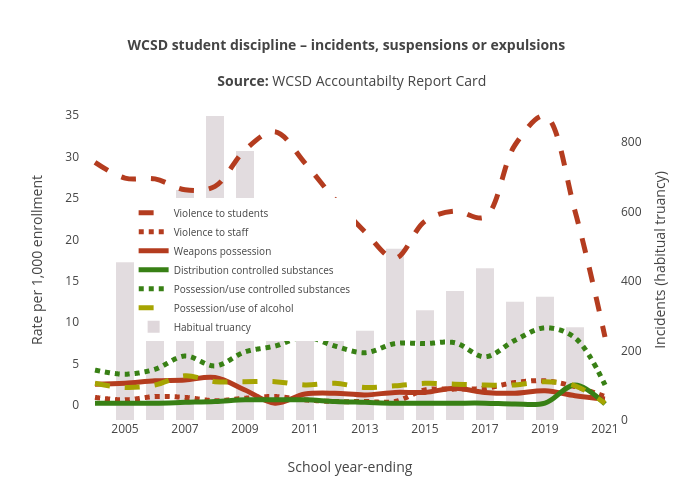
Truckeemeadowstomorrow's interactive graph and data of "WCSD student discipline – incidents, suspensions or expulsions Source: WCSD Accountabilty Report Card" is a line chart, showing Violence to students, Violence to staff, Weapons possession, Distribution controlled substances, Possession/use controlled substances, Possession/use of alcohol, Habitual truancy; with School year-ending in the x-axis and Rate per 1,000 enrollment in the y-axis.. The x-axis shows values from 2003.5 to 2021.5. The y-axis shows values from -1.833333333333333 to 36.83333333333333.