Edit chart
Loading graph
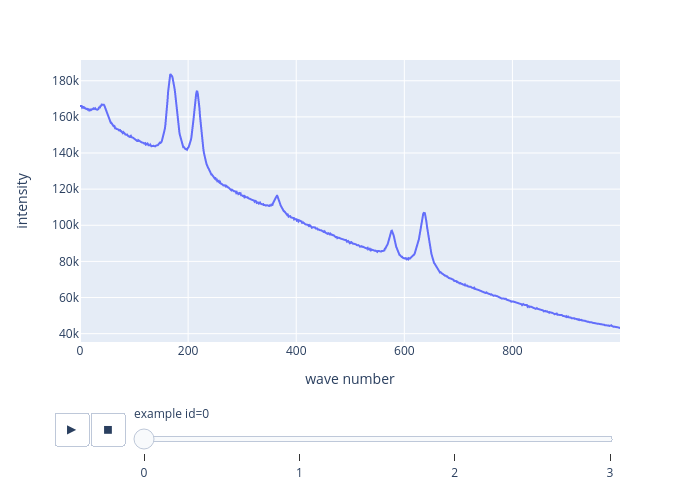
Thundershiviah's interactive graph and data of "intensity vs wave number" is a line chart; with wave number in the x-axis and intensity in the y-axis.. The x-axis shows values from 0 to 999. The y-axis shows values from 35385.9771369759 to 191485.91301634265.