Edit chart
Loading graph
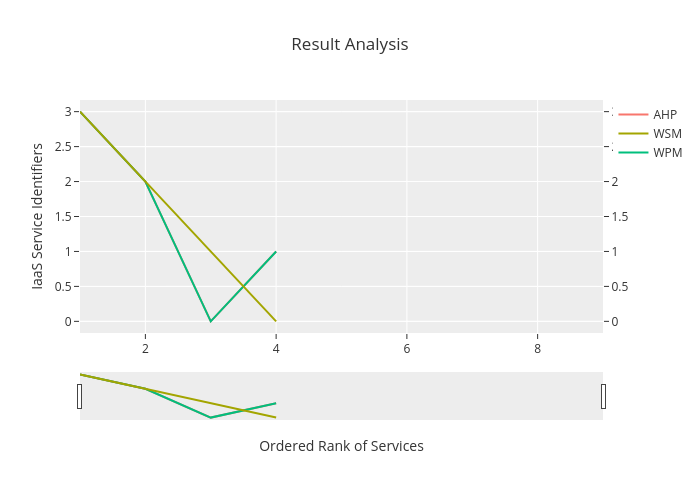
Teja001's interactive graph and data of "Result Analysis" is a line chart, showing AHP, WSM, WPM; with Ordered Rank of Services in the x-axis and IaaS Service Identifiers in the y-axis.. The x-axis shows values from 1 to 9. The y-axis shows values from -0.16666666666666666 to 3.1666666666666665.