Edit chart
Loading graph
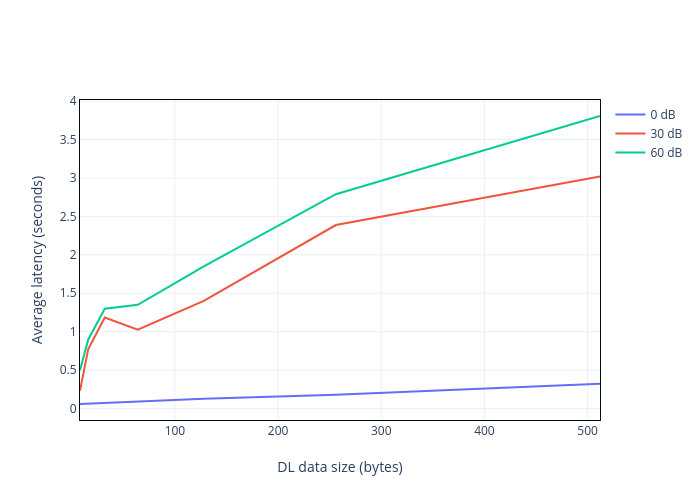
Subhoshankarbasu's interactive graph and data of "Average latency (seconds) vs DL data size (bytes)" is a line chart, showing 0 dB, 30 dB, 60 dB; with DL data size (bytes) in the x-axis and Average latency (seconds) in the y-axis.. The x-axis shows values from 8 to 512. The y-axis shows values from -0.1477976533055555 to 4.0134973308055555.