Edit chart
Loading graph
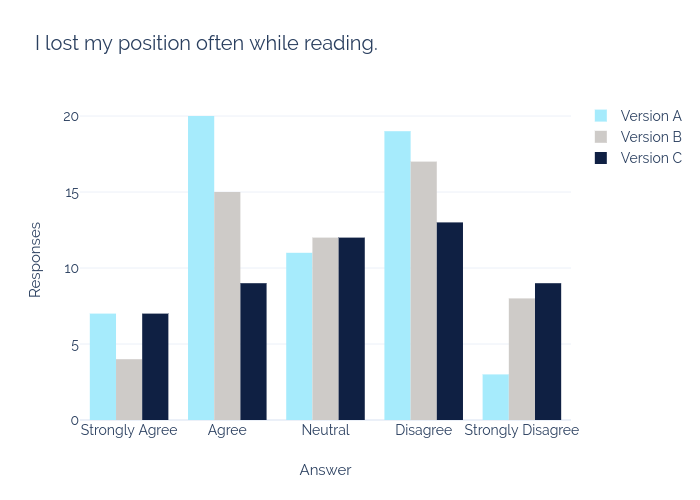
Seaspree's interactive graph and data of "I lost my position often while reading." is a bar chart, showing Version A, Version B, Version C; with Answer in the x-axis and Responses in the y-axis.. The x-axis shows values from -0.5 to 4.5. The y-axis shows values from 0 to 21.05263157894737.