Edit chart
Loading graph
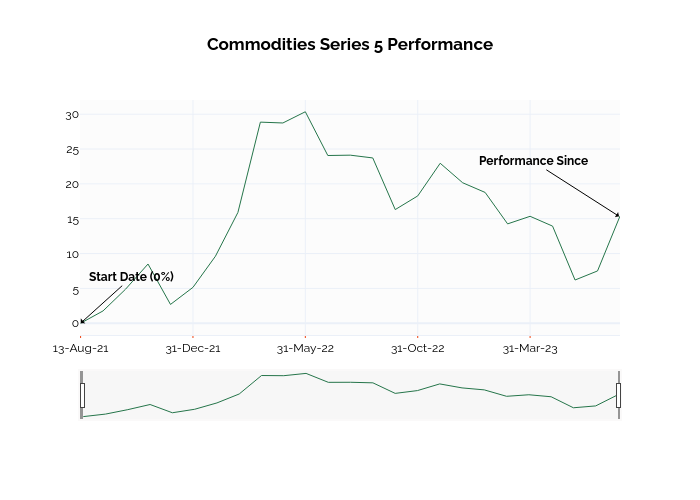
Ssi_plotly's interactive graph and data of "Commodities Series 5 Performance" is a line chart; with in the x-axis. The x-axis shows values from -0.025917009653483807 to 24. The y-axis shows values from -1.6861111111111111 to 32.03611111111111. This visualization has the following annotations: Start Date (0%); Performance Since