Edit chart
Loading graph
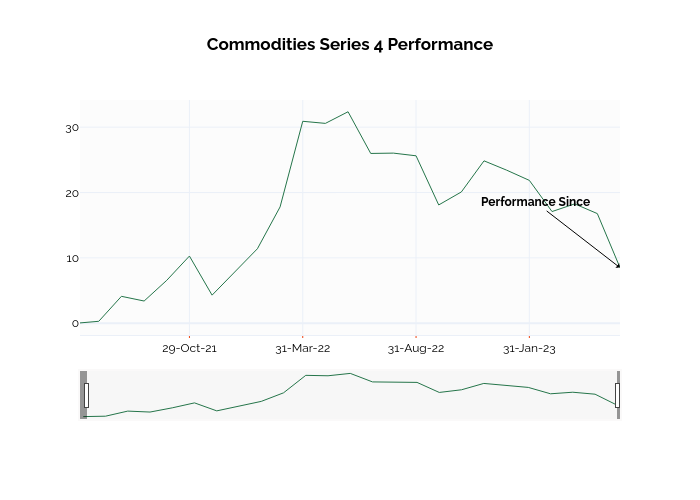
Ssi_plotly's interactive graph and data of "Commodities Series 4 Performance" is a line chart; with in the x-axis. The x-axis shows values from 0.17119655794255217 to 24. The y-axis shows values from -1.7977777777777775 to 34.157777777777774. This visualization has the following annotations: Start Date (0%); Performance Since