Edit chart
Loading graph
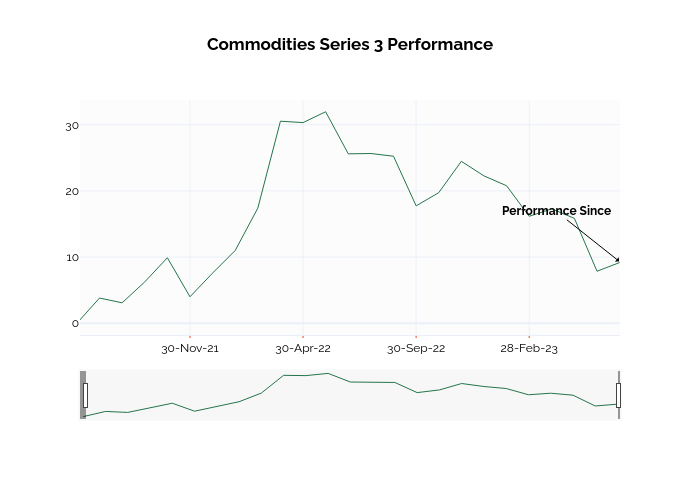
Ssi_plotly's interactive graph and data of "Commodities Series 3 Performance" is a line chart; with in the x-axis. The x-axis shows values from 0.13673301742926758 to 24.015624352062865. The y-axis shows values from -1.7755555555555558 to 33.73555555555556. This visualization has the following annotations: Start Date (0.00%); Performance Since