Edit chart
Loading graph
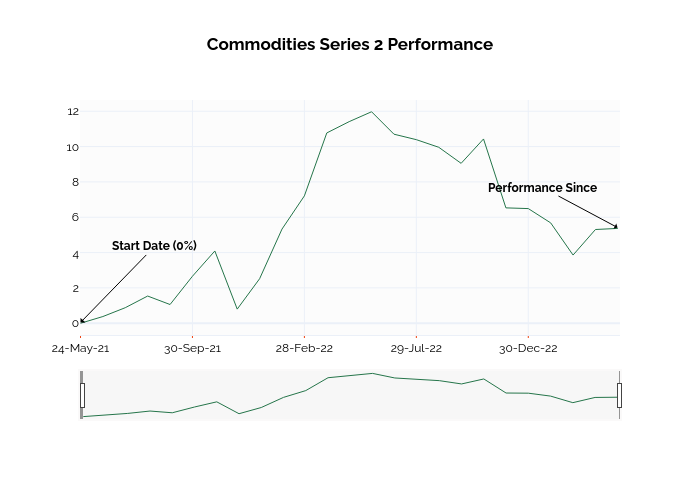
Ssi_plotly's interactive graph and data of "Commodities Series 2 Performance" is a line chart; with in the x-axis. The x-axis shows values from -0.02253965792201048 to 24.095938235040276. The y-axis shows values from -0.6650000000000001 to 12.635000000000002. This visualization has the following annotations: Start Date (0%); Performance Since