Edit chart
Loading graph
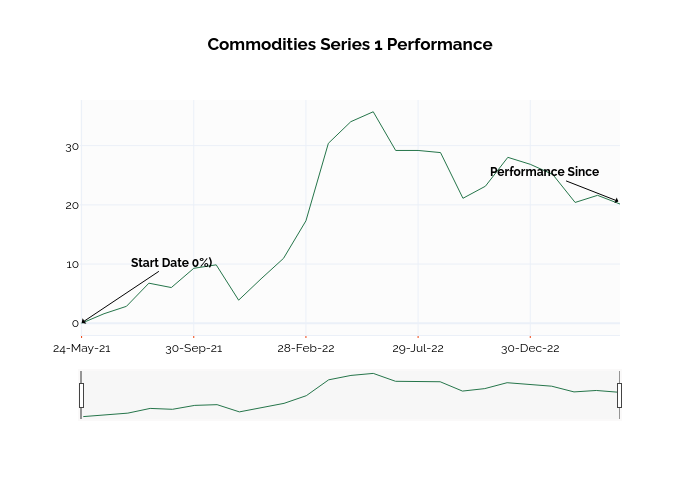
Ssi_plotly's interactive graph and data of "Commodities Series 1 Performance" is a line chart; with in the x-axis. The x-axis shows values from -0.07104951811941804 to 24. The y-axis shows values from -1.9849999999999999 to 37.714999999999996. This visualization has the following annotations: Start Date 0%); Performance Since