Edit chart
Loading graph
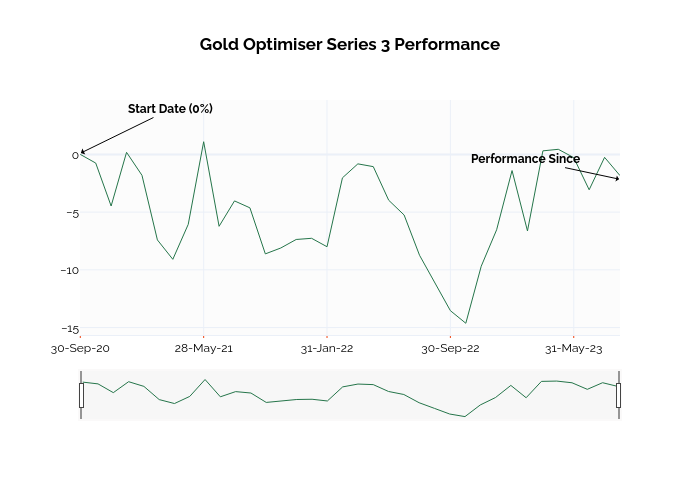
Ssi_plotly's interactive graph and data of "Gold Optimiser Series 3 Performance" is a line chart; with in the x-axis. The x-axis shows values from -0.019788660268778874 to 35. The y-axis shows values from -15.849992951755667 to 8.549866083357667. This visualization has the following annotations: Start Date (0%); Performance Since