Edit chart
Loading graph
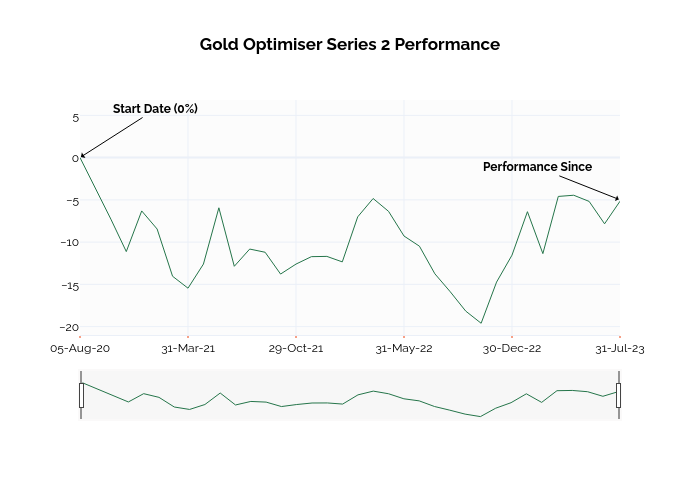
Ssi_plotly's interactive graph and data of "Gold Optimiser Series 2 Performance" is a line chart; with in the x-axis. The x-axis shows values from 0 to 35. The y-axis shows values from -20.939881004273268 to 5.857739081192044. This visualization has the following annotations: Start Date (0%); Performance Since