Edit chart
Loading graph
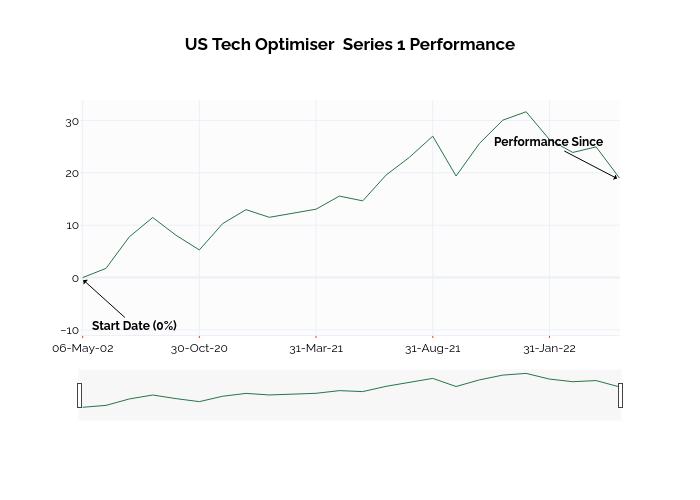
Ssi_plotly's interactive graph and data of "US Tech Optimiser Series 1 Performance" is a line chart; with in the x-axis. The x-axis shows values from -0.03164793324552577 to 23. The y-axis shows values from -6.532932895893885 to 33.67015436294179. This visualization has the following annotations: Start Date (0%); Performance Since