Edit chart
Loading graph
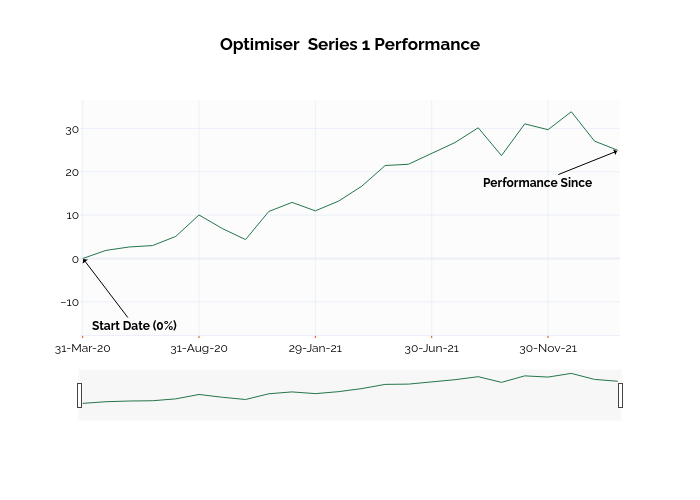
Ssi_plotly's interactive graph and data of "Optimiser Series 1 Performance" is a line chart; with in the x-axis. The x-axis shows values from -0.03169319506969809 to 23.017771438054567. The y-axis shows values from -16.786248654851644 to 36.515065718676404. This visualization has the following annotations: Start Date (0%); Performance Since