Edit chart
Loading graph
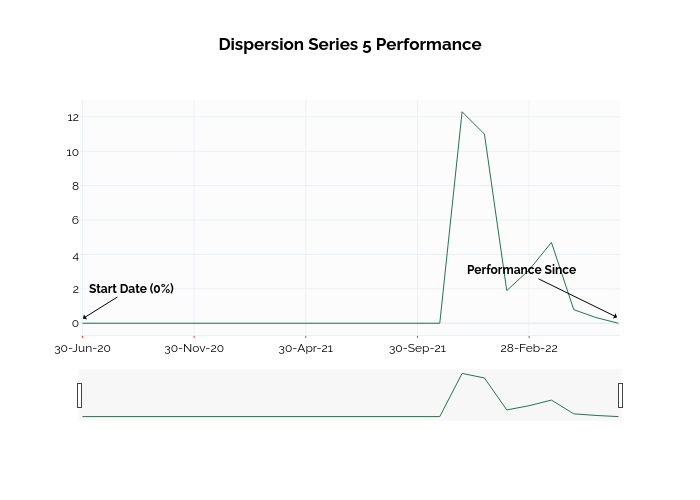
Ssi_plotly's interactive graph and data of "Dispersion Series 5 Performance" is a line chart; with in the x-axis. The x-axis shows values from -0.030983997276132106 to 24. The y-axis shows values from -0.6833333333333333 to 12.983333333333334. This visualization has the following annotations: Start Date (0%); Performance Since