Edit chart
Loading graph
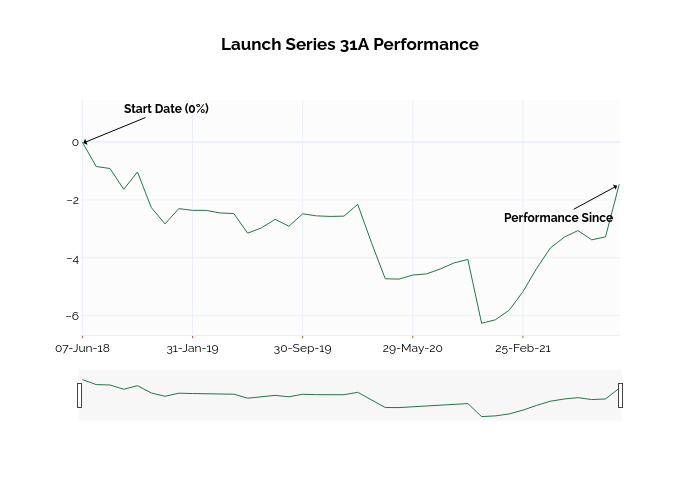
Ssi_plotly's interactive graph and data of "Launch Series 31A Performance" is a line chart; with in the x-axis. The x-axis shows values from -0.05511221945137158 to 39. The y-axis shows values from -6.662778862896509 to 1.1927983950336891. This visualization has the following annotations: Start Date (0%); Performance Since