Edit chart
Loading graph
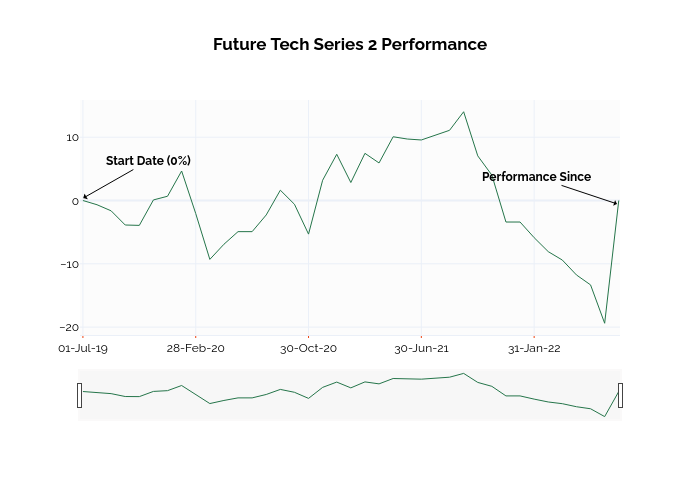
Ssi_plotly's interactive graph and data of "Future Tech Series 2 Performance" is a line chart; with in the x-axis. The x-axis shows values from -0.06985122104362725 to 38. The y-axis shows values from -21.246111111111112 to 15.876111111111111. This visualization has the following annotations: Start Date (0%); Performance Since