Edit chart
Loading graph
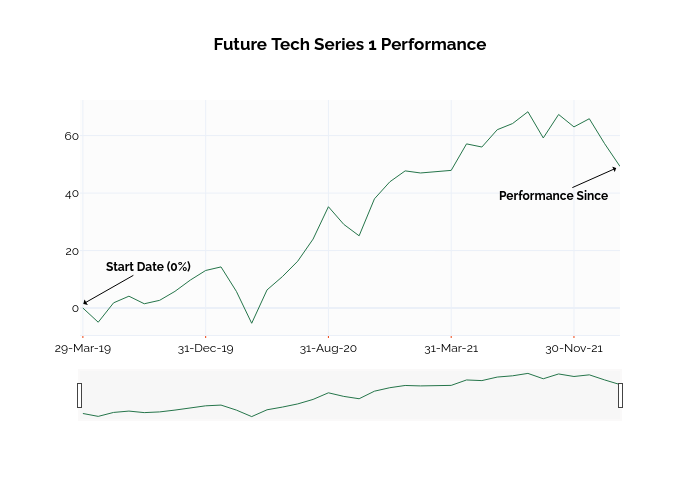
Ssi_plotly's interactive graph and data of "Future Tech Series 1 Performance" is a line chart; with in the x-axis. The x-axis shows values from -0.1491504107029505 to 35. The y-axis shows values from -9.387777777777778 to 72.36777777777777. This visualization has the following annotations: Start Date (0%); Performance Since