Edit chart
Loading graph
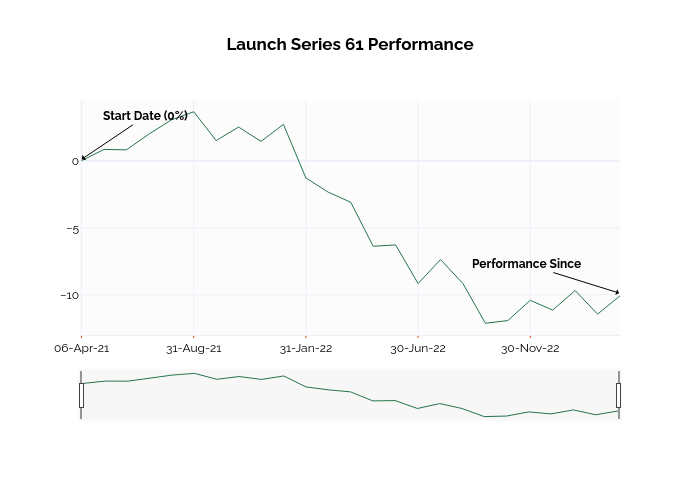
Ssi_plotly's interactive graph and data of "Launch Series 61 Performance" is a line chart; with in the x-axis. The x-axis shows values from -0.06841551099208508 to 24. The y-axis shows values from -13.147764138098012 to 7.40751862386222. This visualization has the following annotations: Start Date (0%); Performance Since