Edit chart
Loading graph
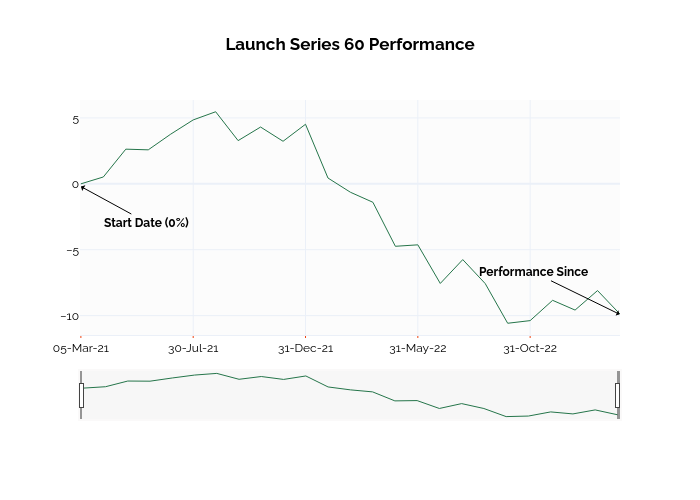
Ssi_plotly's interactive graph and data of "Launch Series 60 Performance" is a line chart; with in the x-axis. The x-axis shows values from -0.03924338969806441 to 24. The y-axis shows values from -11.471666666666668 to 6.361666666666666. This visualization has the following annotations: Start Date (0%); Performance Since