Edit chart
Loading graph
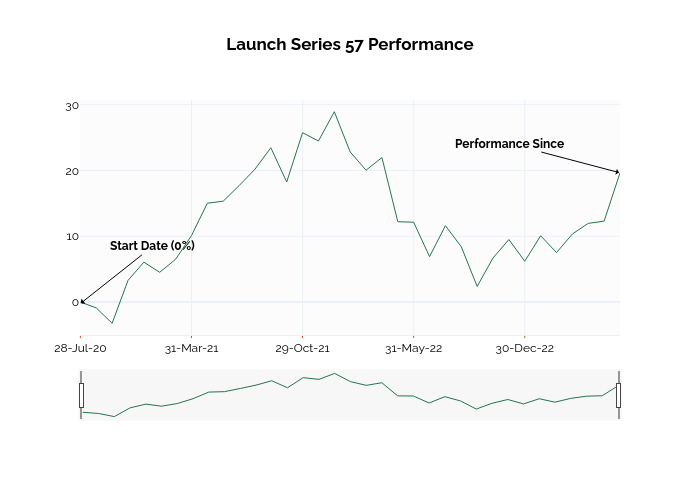
Ssi_plotly's interactive graph and data of "Launch Series 57 Performance" is a line chart; with in the x-axis. The x-axis shows values from -0.024236467383649762 to 34. The y-axis shows values from -5.0055555555555555 to 30.705555555555556. This visualization has the following annotations: Start Date (0%); Performance Since