Edit chart
Loading graph
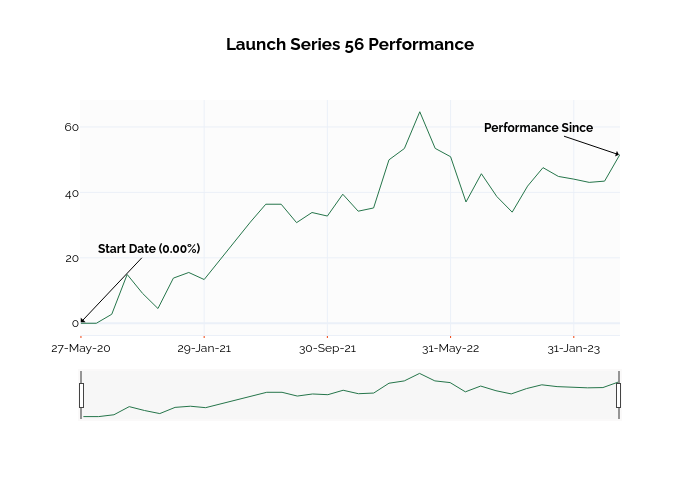
Ssi_plotly's interactive graph and data of "Launch Series 56 Performance" is a line chart; with in the x-axis. The x-axis shows values from -0.061754271498605184 to 35. The y-axis shows values from -3.591666666666667 to 68.24166666666667. This visualization has the following annotations: Start Date (0.00%); Performance Since