Edit chart
Loading graph
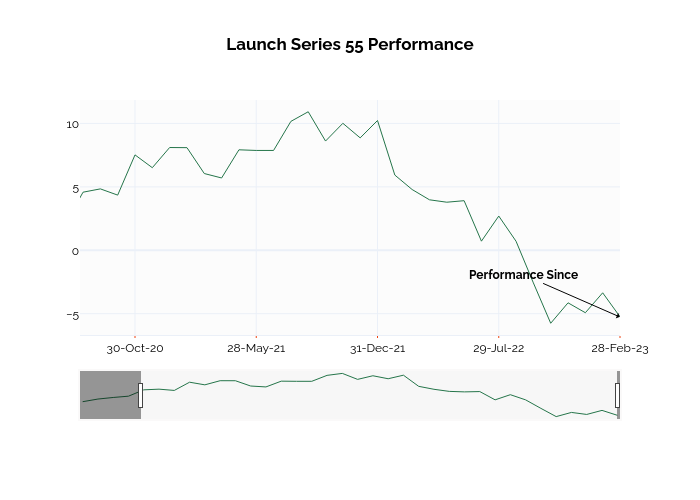
Ssi_plotly's interactive graph and data of "Launch Series 55 Performance" is a line chart; with in the x-axis. The x-axis shows values from 3.8246017880913405 to 35. The y-axis shows values from -6.676111111111111 to 11.846111111111112. This visualization has the following annotations: Start Date (0%); Performance Since