Edit chart
Loading graph
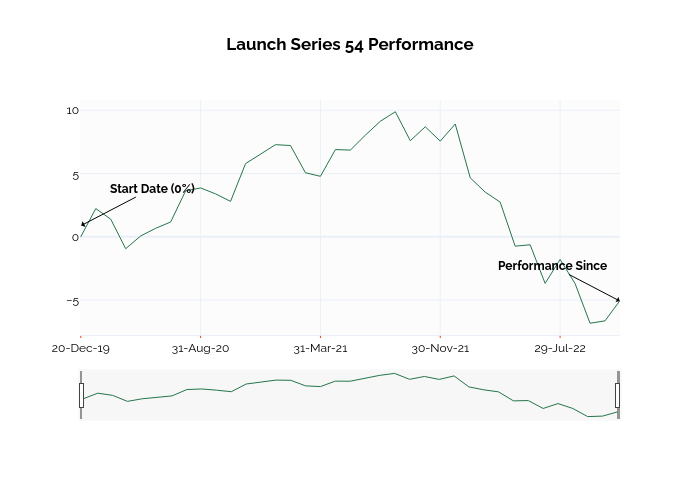
Ssi_plotly's interactive graph and data of "Launch Series 54 Performance" is a line chart; with in the x-axis. The x-axis shows values from -0.05202889534751156 to 36. The y-axis shows values from -7.758333333333334 to 10.808333333333334. This visualization has the following annotations: Start Date (0%); Performance Since