Edit chart
Loading graph
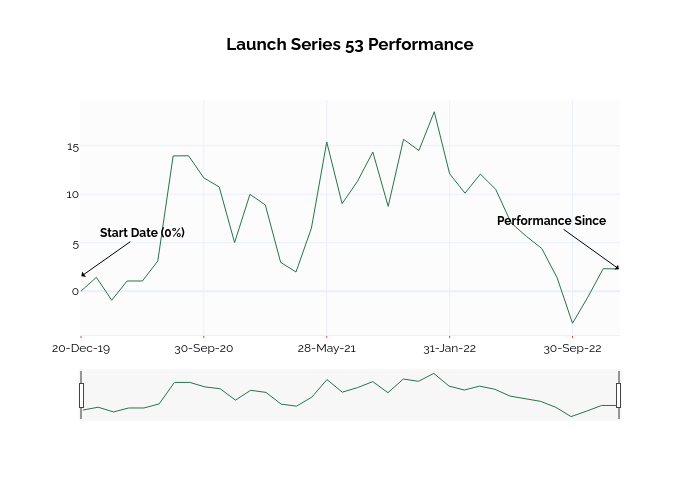
Ssi_plotly's interactive graph and data of "Launch Series 53 Performance" is a line chart; with in the x-axis. The x-axis shows values from -0.0641881113773267 to 35.09226048332605. The y-axis shows values from -4.522222222222222 to 19.722222222222225. This visualization has the following annotations: Start Date (0%); Performance Since